Navigation Guide for SEKAR App & Web Dashboard
Guide to understand the layout and navigation in SEKAR mobile app and web dashboard.
SEKAR Mobile App
The mobile app menu with feature shortcuts.
Main Layout
The mobile app has three main areas:
┌─────────────────────────────────┐
│  [← Back]  Page Title [⊙ Status]│  ← Header
├─────────────────────────────────┤
│                                 │
│      MAIN PAGE CONTENT          │
│      (changes by tab)           │
│                                 │
│                                 │
├─────────────────────────────────┤
│  🏠 Home  |  ☰ Menu  | 👤 Profile│  ← Bottom Tab Bar
└─────────────────────────────────┘
Header (Top)
Main Pages (Home, Menu, Profile):
- Back button (if on sub-page)
- Page title
- Connection Status (Online/Offline/Syncing) on the right
Detail Pages (Tasks, Reports, etc):
- Back button (← arrow) to go back
- Detail page name
- Connection status
Bottom Tab Bar
The app has 3 main tabs always available for all roles:
1. Home 🏠
Main page showing:
- Attendance Card: Clock in/out time for today
- Overtime Status: If overtime is active
- Quick Info: Assigned area, today's schedule
- Floating Button: Quick access to clock in/out
On the Home page, you can tap the large button to clock in or out without opening the menu.
2. Menu (☰)
Menu is the launcher for all features. Content varies by role:
For Satgas/Linmas (Workers):
- Clock In/Out
- Overtime
- Tasks
- Activities
- Schedule
- Profile
For Korlap (Coordinator):
- Monitoring
- Manage Tasks
- Validate Reports
- Team Analytics
- Profile
For Rayon Head & Management:
- Monitoring
- Reports
- Analytics
- Data Master
- Profile
Menu works like an app launcher — tap an icon to open that feature.
3. Profile (👤)
Your profile page with:
- Profile photo
- Full name and phone number
- Role/position
- Rayon and area information
- Settings — Change password, notifications, language
- Diagnostics — Device info and app version
- Logout — Sign out of the app
SEKAR Web Dashboard
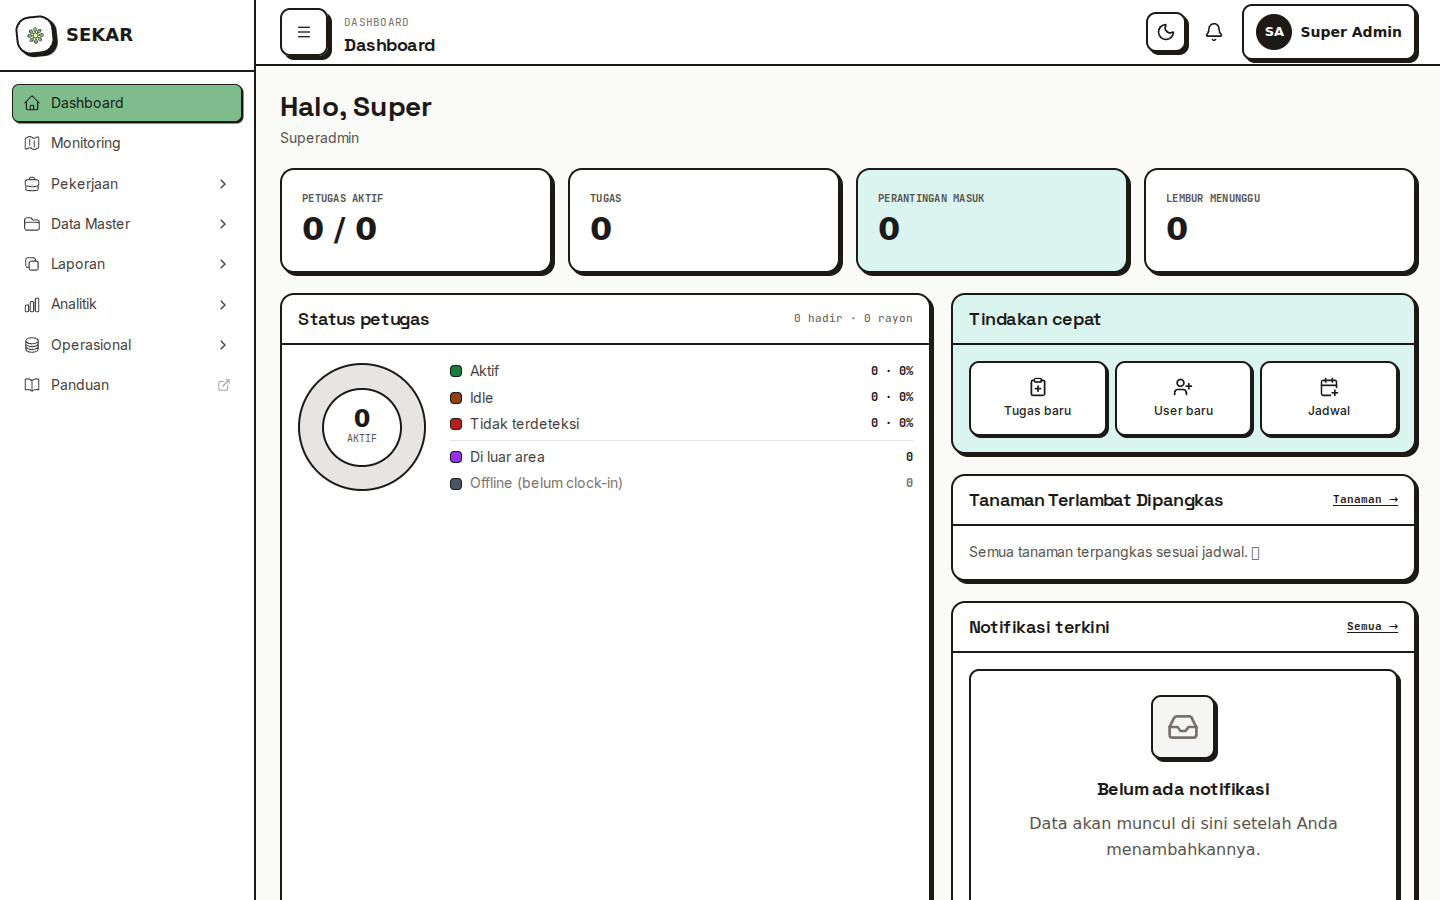
The web dashboard overview.
Main Layout
The web dashboard has 3 main sections:
┌──────────────────────────────────────────────────┐
│  SEKAR Logo  │  Navigation  │  [👤 Avatar] [⚙️ ⚪]│ ← Header
├──────────────────────────────────────────────────┤
│                                                  │
│  ┌────────────┐                                  │
│  │   Sidebar  │    MAIN PAGE CONTENT            │
│  │            │                                  │
│  │  Dashboard │    (different per page)         │
│  │  Users     │                                  │
│  │  Rayon     │                                  │
│  │  Reports   │                                  │
│  │  etc       │                                  │
│  │            │                                  │
│  └────────────┘                                  │
└──────────────────────────────────────────────────┘
Header
At the top of the web dashboard:
- SEKAR Logo on the left
- Page Title in the center
- Your Avatar on the right (click for menu)
- Dark/Light Mode toggle (circle ⚪)
Sidebar (Left Menu)
Sidebar shows main navigation. Content varies by role:
For Admin Data & Admin System:
📊 Dashboard
👥 Users
📍 Rayon & Area
🌿 Data Master
  - Plants
  - Seedlings
  - Assets
📋 Operations
  - Reports
  - Export/Import
For Rayon Head:
📊 Dashboard
📋 Reports
📈 Analytics
📍 My Rayon
🗺️ Monitoring
For Top Management:
📊 Dashboard
📈 Analytics
📋 Reports
👥 Users
Click a menu item to open that page. The active page will be highlighted.
Main Content
The center/right area showing:
- Dashboard Page: Graphs, statistics, summary cards
- Data List: Tables of users, reports, areas, etc
- Form: For creating/editing data
- Detail: Full information about an item
Avatar & Settings (Top Right)
Click your avatar to open menu:
- My Profile — Edit name, photo, personal info
- Settings — Notifications, language, theme
- Logout — Sign out of dashboard
Common Navigation in Mobile App
Opening Features from Menu
- Tap the Menu (☰) tab at the bottom
- Menu grid will show various features
- Tap the feature icon you want to open
- Wait for page to load
- To go back, tap the back button (←) in header or swipe from left edge
Opening Reports/Tasks from List
- Tap Menu > Tasks or Activities
- List will show all items
- Tap an item to open its details
- Tap Back to return to the list
Connection Status
Pay attention to the status at the top right of header:
- 🟢 ONLINE ��— App is connected to server, all features active
- 🔴 OFFLINE — App not connected, only local features available
- 🟡 SYNCING — Currently uploading data to server
If status is OFFLINE, make sure you have internet connection. Some features might not be available.
Common Navigation in Web Dashboard
Switching Pages
- Click a menu item in the left sidebar
- Page will change
- Use browser back button (←) to go back
Opening Data Detail
- Click a page from sidebar (example: "Users")
- Table or list will appear
- Click a row or "Detail" button to open item details
- Click back or click menu again to return to list
Creating New Data
- Open a page (example: "Users")
- Find "+ New" or "+ Add" button (usually above table)
- Form will appear
- Fill in data and click "Save"
Filter & Search
On list pages, you often find:
- Search Box — Type to search data
- Filter Dropdown — Select filter criteria
- Reset Button — Clear all filters
Navigation Tips
1. Pay Attention to Connection Status — Always check if you're online before important actions.
2. Use Back Button — Don't close the app, use the back button for normal navigation.
3. Menu vs Detail Pages — Menu is a launcher, detail pages are content. Going back from detail brings you to menu or previous page.
4. Save Before Leaving — If editing data, make sure to click "Save" before going back.
Need navigation help? See FAQ & Help or the guide for your role.