Reports and Rayon Performance Analytics
Guide for Rayon Head to view performance reports and analytics for your rayon.
What is Rayon Head Dashboard?
Rayon Head Dashboard displays:
- Performance Summary — Attendance, productivity, quality overview
- Detailed Reports — Per worker, per area, per period
- Analytics Graphics — Performance trends, target vs actual comparison
- Data Export — For official reports to management
Opening Dashboard
- Log in to web dashboard with your Rayon Head account
- You'll see the dashboard home with summary cards
Rayon Performance Summary
The performance reports and metrics overview.
Main Cards
┌─────────────────────────────────────┐
│ RAYON PERFORMANCE TODAY             │
├─────────────────────────────────────┤
│                                     │
│ Attendance          │ Report Quality│
│ ████████░░ 85%     │ ████░░░░░░ 72%
│ 17/20 present      │ Good quality reports
│                                     │
│ Overtime Today     │ Activity Target
│ ██░░░░░░░░ 20%    │ ████████░░ 82%
│ 4 people overtime  │ 82/100 areas
│                                     │
└─────────────────────────────────────┘
Main Metrics Displayed
| Metric | Meaning | Target |
|---|---|---|
| Attendance | % of workers present that day | 100% |
| Timeliness | % of on-time attendance (not late) | >90% |
| Report Quality | % of approved reports (not rejected) | >80% |
| Activity Target | % of areas completed vs target | >85% |
| Productivity | Average reports per worker per day | Min 3 reports |
Monthly Report
Opening Monthly Report
- On dashboard, find "Reports" or "Reports" section
- Tap "Monthly Report"
- Select month to view
Report Content
RAYON PERFORMANCE REPORT - JUNE 2026

SUMMARY
Total Workers: 20
Total Work Days: 22
Total Work Hours: 440 hours
Total Reports: 485

ATTENDANCE
Present: 85% (average 17 people per day)
Late: 12% (average 2 people per day)
Absent Without Notice: 3% (average 0.5 people per day)

WORK QUALITY
Reports Approved: 82% (397 reports)
Reports Rejected: 8% (39 reports)
Reports Need Revision: 10% (49 reports)

AREA COVERAGE
Taman Bungkul Area: 90% coverage
Parking Area: 75% coverage
Playground Area: 88% coverage

TOP WORKERS
1. Ahmad Rizki - 95% attendance, 25 reports, 92% approved
2. Budi Santoso - 90% attendance, 22 reports, 86% approved
3. Citra Dewi - 88% attendance, 20 reports, 85% approved

WORKERS NEEDING IMPROVEMENT
1. Doni Hartono - 70% attendance, 30% reports rejected
2. Eka Putri - 75% attendance, 25% reports rejected
Trend Analytics
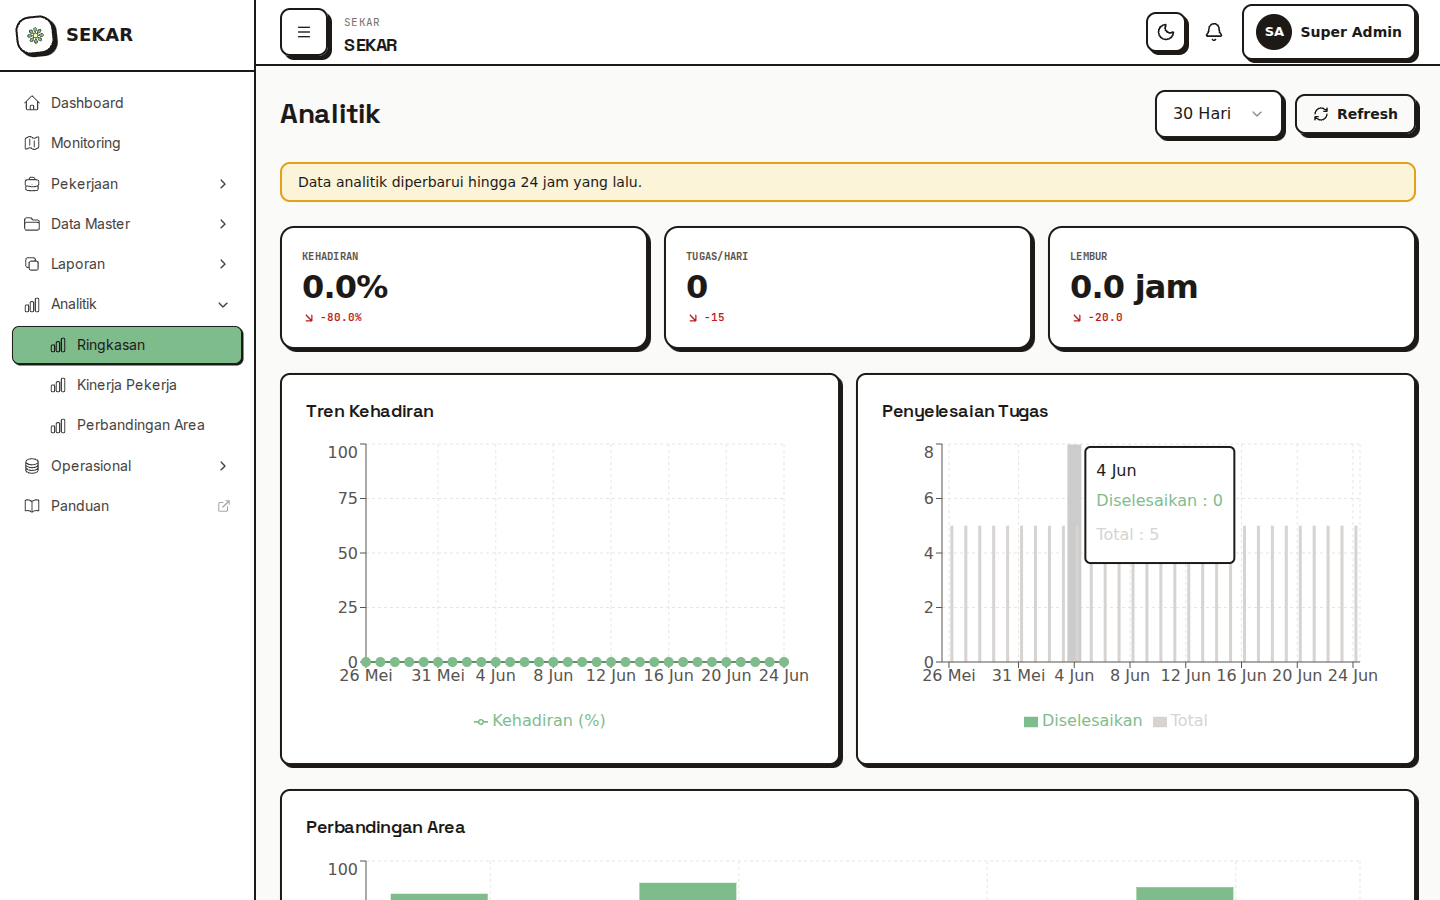
The analytics and trend visualization dashboard.
Graphics & Visualization
Dashboard displays charts for trend analysis:
1. Attendance Trend (Monthly)
- Attendance trend line per week
- Identify patterns (ex: always low on Friday)
2. Report Quality (Trend)
- Percentage of approved vs rejected reports
- Quality trend up/down
3. Productivity (Activities per Worker)
- Average reports per worker per week
- Worker productivity comparison
4. Area Coverage (Heat Map)
- Map with colors showing coverage intensity per area
- Identify frequently/rarely worked areas
Exporting Reports
How to Export Reports
- On report page, look for "Export" or "Download" button
- Choose format:
- PDF — For printing and formal reports
- Excel — For further analysis
- Select period (week/month/custom date range)
- Tap "Download" or "Generate"
- File will be saved to your device
Using Export for Management Reports
Export data can be used for:
- Report to Top Management — Share rayon performance summary
- Worker Evaluation — Base for annual performance assessment
- Planning — Analyze trends for improvement planning
- Communication — Share with team for transparency
Filters & Customization
Filter Reports
You can filter reports by:
- Period — Day, week, month, custom range
- Worker — Individual worker report
- Area — Performance per area
- Activity Type — Per work category (cleaning, maintenance, etc)
Custom Report
Some dashboards allow you to create custom report:
- Choose Metrics — Which metrics to display
- Choose Period — Date range
- Choose Dimension — Per area, per worker, per type
- Generate — System generates custom report
Benchmarking & Target
KPI (Key Performance Indicator)
Dashboard shows your rayon KPI vs target/standard:
RAYON PUSAT KPI VS TARGET

                      Actual    Target    Status
Attendance            85%       95%       ❌ Below
Timeliness            78%       90%       ❌ Below
Report Quality        82%       85%       ✓ Close
Activity Target       82%       90%       ❌ Below
Overtime/Month        32 hours  50 hours  ✓ Good
Analyzing Deviation
If actual is far from target:
- Check detailed report to identify issue
- Look at trend — is it consistent or occasional?
- Analyze root cause — specific issue, workload, or skill?
- Plan improvement — action plan to reach target
Communicating Report Results
Feedback to Team
After report is done:
- Share with Team — Transparency is key
- Highlight Achievements — Appreciate positive results
- Identify Issues — Discuss improvement areas
- Plan Improvement — Create action plan together
- Follow-up — Check if improvement strategy works
Report to Management
Report also needs to be shared with Top Management:
- Simplify — Make summary for leadership (1-2 pages)
- Focus on Business — Not technical details, but impact
- Identify Issues — What needs management attention
- Recommend — What needs support/resources from above
Troubleshooting Dashboard
"Report Data Not Updating"
Solution:
- Refresh page (F5 or pull-to-refresh)
- Log out and login again
- Check internet connection
- Contact admin if still not updating
"Can't Export Report"
Solution:
- Make sure you have export permission (Rayon Head, Top Management)
- Check internet connection is stable
- Choose period not too large (ex: 1 month instead of 1 year)
- Contact admin if still fails
"Metrics Don't Make Sense"
Solution:
- Check if there are pending reports not validated (status pending)
- View detailed reports to verify
- Contact Korlap if any data seems wrong
Tips for Using Dashboard
1. Check Regularly
- View dashboard at least 2x per week
- Monitor KPI and trends
- Identify issues early
2. Deep Dive to Details
- If KPI drops, check detailed report
- Look per worker to identify problem
- Don't just look at aggregate numbers
3. Share Transparently
- Share reports with team
- Discuss trends and challenges
- Plan improvement together
4. Take Action
- Don't just report, take action
- If issue found, create improvement plan
- Follow-up progress on improvement
5. Benchmark
- Compare with other rayons (if possible)
- Look at best practices from high performers
- Apply improvement ideas to your rayon
Need report help? See FAQ & Help or contact your system admin.